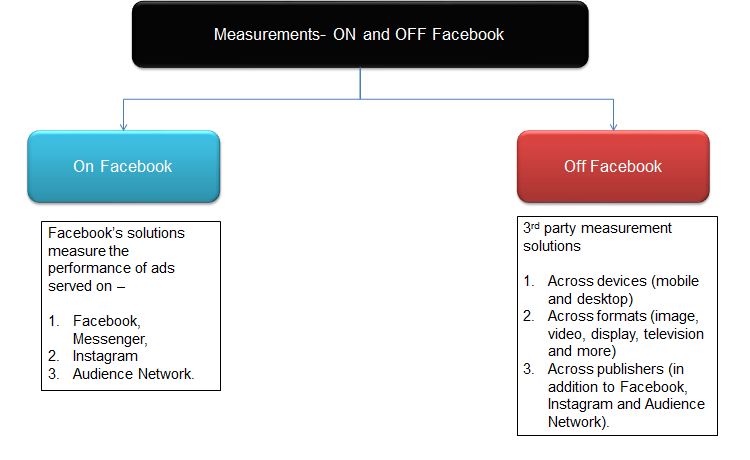
This is a simplified guide for Advertisers, I will talk about how the Facebook and 3rd party/ Partner measure the effect of Facebook Advertisements- both On and Off Facebook across placements and devices .
Facebook measurement solution measures the core business outcomes across 3 major areas, below are more details on this.

It measures the cross device impact as seen below across devices

Advertisers can see if their ads are driving value across their entire media spend, both on and off Facebook properties.
Measuring Audience Outcomes
To measure the audience outcomes, Advertisers should focus on below 4 mentioned key areas as stated below:
- Reach and Frequency
- Split Testing
- Audience Insights
- Viewability
Reach and Frequency

Reach is the number of people who saw your ads at least once, which is different from impressions, which may include multiple views of your ads by the same people.
Frequency is the average number of times each person saw your ad.
Tip- Combine the Reach and Frequency with Brand Lift and/or Conversion lift. This can help you determine your optimal reach and frequency that’s required to drive your business goals.
Reach is already visible in the dashboard, to activate or make the Frequency visible in the dashboard, just click on the drop-down (select Performance) on top right and once it opens, click on the Frequency text box as shown below

Split Test
The second element after Reach and Frequency under Audience measurement is Split testing.
According to Facebook, split testing can be help you as mentioned below
Split testing helps you understand how different aspects of your ads affect campaign performance across the Facebook family of apps and services. Split testing lets you test different versions of your ads so you can see what works best, then keep building on the success of your campaigns and improve future media plans. Split testing divides your audience into random, non-overlapping groups of people who are shown ad sets that are identical in every way except for the audience, placement or creative strategy variable you've chosen to test.This randomization helps ensure the test does not introduce other factors that may skew the results of the group comparison. It also ensures each ad set is given an equal chance in the auction.
Split testing is available for 4 variables, you can test one variable at a time
- Target audience
- Delivery optimization
- Placements
- Creative.
Audience insights

Audience insights shows the aggregated data and does not show any PII
You can get the below mentioned information by using Audience Insights
- Get demographic information including trends about age and gender, relationship status and job roles.
- Learn where your audience is located and the languages they speak.
Viewability
Viewability measures how many ad impressions were viewed by your audience and for how long. When combined with reach measurement, viewability can give you a full picture of how your media plan was delivered. You can measure and verify viewability metrics for Facebook and Instagram through select viewability partners.
Facebook works with 3rd party independent vendors to make sure the viewability is properly measured.
Measuring Brand Outcomes
To measure the Brand outcomes, Advertisers should focus on the below 2 areas
- Estimated Ad Recall Lift (people) — known as “EARL”
- Reach.
Ad recall is measured when people exposed to an ad are later asked if they remember the ad; lift refers to the estimated difference in ad recall between people who saw the ad and those who didn’t.
The data Facebook shows is not accurate but based on estimates.
To activate this feature in the dashboard, go to Performance and under Engagement, click on 'Estimated Ad recall Lift (people)

Once activated, this is how the data is shown in the dashboard

Brand can check whether or not, the audience can remember seeing their ads
Advertisers and Brands can use Brand Lift to:
- Understand how well their campaign resonates with their audience.
- See how their campaign performs against the norms for campaigns in their industry and their region.
- See the demographic breakdowns (age, gender, TV viewership groups and video view durations) that drive the highest lift.
Below is how the Brand lift works as per Facebook
Polls are served in the platform where the user saw the ad.Before your campaign launches, we’ll randomize your target audience into exposed and control groups with similar characteristics. Between 4 and 48 hours after they see your ad, people in the exposed group will receive a poll pertaining to ad recall or other strategic brand objectives pertinent to your business, such as message association or purchase intent. By comparing aggregated poll results from people who saw your ads (exposed group) with people who didn’t see your ads (control group), you can measure the success of your campaign.
Measuring Sales Outcomes
Sales outcomes help Advertisers and Brands to identify the ads are driving value across your entire media spend, both on and off Facebook
Sales is generally measured as conversions and FB defines it as below
A conversion occurs when a person takes an action that is valuable to your business. Examples of a conversion include people making a purchase on your website, installing your mobile app or viewing a specific page of your website.
There are 2 types of conversions as stated below:
Online Conversions: Measure the actions people take online after people see or engage with your ads.
How to make this happen?
To make this actionable, Advertisers needs to implement Facebook pixel on your website and/or Facebook SDK in your mobile app

Offline Conversions: Measure the number of transactions that occur in your physical retail store(s) and through other offline channels (Ex: by phone) after people see or engage with your ads.
How to make this happen?
After your campaign starts delivering, you’ll need to upload your transaction data through Business Manager or integrate directly with Facebook using the Offline Conversions API. This allows Facebook to match transactions that occurred offline (via your data) with Facebook’s data on who viewed your ads, giving you a complete picture of the customer journey and the performance of your campaign.

Facebook Conversion Lift
Facebook’s Conversion Lift enables advertisers to measure the true impact of their Facebook ads.
How Advertisers can use it?
Advertisers and Brands can use Conversion Lift to determine the incremental sales and conversions from people reached by your ads across the Facebook family of apps and services.
This is how it works as per Facebook
When you run a Facebook campaign, Conversion Lift randomizes and splits your ad audience into two groups (one that sees your Facebook ads and another that doesn’t). As your campaign progresses, you can share your conversion data with Facebook, whether it happens online, offline or in your mobile app. We’ll calculate the lift (the additional business you captured) by comparing conversions in the group that saw your ads and the one that didn’t, and make the results available to you in Ads Manager.
Facebook Attribution
With Facebook Attribution, Brands can understand the impact of their ads across publishers, channels and devices.
Facebook offers 2 options for measuring conversions
- Visits- Facebook provides a reports on visits across publishers, you have to make sure that you are using UTM parameters with your ads to see this data.
- Tags- To see more advanced data and cross publisher reporting, brands can add other third-party platforms to Facebook Attribution by applying click and impression tags to their off-Facebook media.
Brands can track multi touch Attribution by working with Facebook partners, this will help brands to:
- Track complete Facebook media plan.
- Understand ROI.
- Make accurate investment decisions across all media channels.
MTA distributes credit among multiple impressions and clicks that occur over a person's purchase journey, and gives marketers a better look at the full picture.

Marketing mix modeling
MMM provides insights into sales impacts which leads to determining an optimal budget allocation across channels, brands and countries.

MMM helps answer the questions:
- How many sales did each of my marketing investments drive?
- What was the ROI of each marketing channel across all my brands?
- Where should my next marketing investment be?
- How would sales be impacted if I made X change to my marketing plan?
Mobile Measurement
Advertisers can work with 3rd party Measurement partners like Adjust to understand how their ads across the Facebook family of apps and services drive installs and revenue for their app compared to other ad networks.
Thanks for reading!
Sarang Kinjavdekar