Tuesday, 4 July 2023

Understanding SKAdNetwork: Privacy-Centric Attribution for iOS Advertising

Introduction: 


In today's digital landscape, I find mobile advertising to be an essential component in driving app installs and user engagement. However, as a user, I'm concerned about my privacy. That's where SKAdNetwork comes into play. In this article, I'll delve into what SKAdNetwork is, how it works, and why it's significant for both advertisers and user privacy. 


1.The Essence of SKAdNetwork: 

SKAdNetwork, short for StoreKit Ad Network, serves as an alternative to traditional attribution methods, such as the use of device identifiers like IDFA (Identifier for Advertisers). It provides a privacy-focused solution for measuring the effectiveness of ad campaigns without compromising individual user privacy. 


2.Protecting User Privacy: 

At its core, SKAdNetwork is designed to prioritize user privacy by limiting the amount of user data shared with advertisers and ad networks. With SKAdNetwork, advertisers receive aggregated campaign performance data from Apple without accessing specific user-level information. This approach ensures that users' personal data remains safeguarded. 


How SKAdNetwork works?


When a user installs an app from an ad, SKAdNetwork facilitates attribution in a privacy-centric manner. Instead of sharing user-specific details, the framework employs a series of cryptographic techniques to maintain anonymity. Here's a simplified overview of the process:


a. App Install: A user interacts with an ad and proceeds to install the advertised app from the App Store. 

b. Conversion Value: Advertisers assign a conversion value to indicate specific events or actions related to the ad campaign (e.g., in-app purchases or level completions). 

c. Postback: The App Store generates a signed signal called a postback, indicating the install and conversion value. This postback is sent to the ad network, but it contains no identifiable user information. 

d. Attribution: The ad network receives aggregated data from the App Store, allowing them to measure the performance of their ad campaigns while preserving user privacy. 

Benefits for Advertisers: 

SKAdNetwork offers several advantages for advertisers, including: 

a. Privacy Compliance: Advertisers can adhere to privacy regulations and best practices by adopting a privacy-centric attribution framework. 

b. Campaign Measurement: SKAdNetwork enables advertisers to gain insights into the performance of their ad campaigns, such as app installs and conversion events, without accessing individual user data. 

c. User Trust: By prioritizing user privacy, advertisers can build trust with their target audience, fostering positive brand perceptions. 


Wednesday, 10 May 2023

What is Ads.txt and how does it work? Why is it so important? -Complete guide

The IAB Tech Lab introduced the Ads.txt file back in 2017 to safeguard ad inventory and prevent programmatic ad fraud. Since then, it has played a pivotal role in fostering transparency in the digital advertising industry. Despite its effectiveness, many publishers remain apprehensive or unaware of the advantages of this initiative. This article provides a concise summary of Ads.txt, practical tips for implementing it on WordPress and Google AdSense, and how it benefits publishers and advertisers alike.

What is Ads.txt?

Ads.txt, which stands for Authorized Digital Sellers, is a text file created to tackle ad fraud, specifically domain theft and hijacking. It improves the transparency of a publisher's ad inventory by disclosing the origin of purchased and resold impressions.


Through ads.txt, publishers can publicly list the authorized sellers of their ad inventory and prevent fraudulent activities associated with unsanctioned inventory sales. Moreover, ad buyers can verify the sellers and steer clear of unauthorized traffic sales thanks to ads.txt.


Ads.txt serves the following purposes:

  1. Identifying authorized entities to sell publishers' ad inventory.
  2. Allowing buyers, ad exchanges, and others to crawl publishers' domains.
  3. Matching seller account IDs in bid requests.
  4. Shielding advertisers from phony ad inventory.

Here's how ads.txt operates:


Publishers insert the ads.txt file on their website, verifying domain ownership and listing partner accounts (like ad exchanges and SSPs) that can sell their ad inventory. As a result, advertisers can easily access a comprehensive list of all authorized publishers and their ad inventory online.


When a bid request from the publisher reaches the advertiser, they only have to match the publisher's account ID with the ads.txt file.


If the account ID matches, the advertiser can be confident that the publisher is legitimate. Conversely, if the buyer finds that the publisher's ID is unverified, they can choose not to bid on the publisher's ad inventory.

 This is how it works, 

Image source- IAB


Friday, 4 September 2020

Why marketers should focus on 4As and 4Ps combination in their Marketing Mix- By Sarang Kinjavdekar

 4Ps of marketing- many of the marketers are familiar with this term -they are - Product, Price, Place and Promotion. today, we will discuss why it is important to have 4As along with 4Ps when you think about developing an Integrated Marketing mix


According to Philip Kotler, ‘marketing mix is the mixture of controllable marketing variable that the firm uses to pursue the sought level of sales in the target market. Therefore, the marketing mix indicates the appropriate combination of four P’s—product, price, promotion, and place—for achieving marketing objectives. The components are also known as marketing mix variables or controllable variables as they can be used according to business requirements. 

More details below


                                          Source

  • Product includes options, quality, design, features,  packaging and other related services.
  • Price includes list price, marked price, discounts, shipping costs and competitors’ prices.
  • Place includes distribution channels, platforms, websites and other online presences, physical locations, inventory, and delivery.
  • Promotion includes branding, content marketing, advertising, search, influence relations, social media, PR  and sales.

But the problem that Marketers face with 4Ps is, it only gives the seller side of view and completely ignores the buyers side of view.

What exactly are 4As of Marketing?

The 4A framework derives from a customer-value perspective based on the four distinct roles that customers play in the market: seekers, selectors, payers and users. For a marketing campaign to succeed, it must achieve high marks on all four A’s, using a blend of marketing and non-marketing resources

Source

To get the buyers view and then get the sellers view, it is imperative for Marketers to understand and incorporate  4As before applying the 4Ps to the strategic marketing mix.

Lets first take a closer look at 4Ps and see how they align with 4As


Once we have this alignment, we can see a more customer centeres framework. 

  • Acceptability-  the extent to which the product exceed customers expectations.
  • Affordability- the extent to which the customers are willing and able to pay for the product
  • Accessibility- the extent to which the customer readily acquire the product
  • Awareness-the extent to which the customers are informed about the product, features, specifications, differentiation etc


Or simply put:

  • Product designs influences adaptability
  • Prices affects affordability
  • Places affects accessibility
  • Promotion influences awareness


Thus, I highly recommend that one should consider 4As before thinking about the 4Ps.


Thanks for reading

Sarang Kinjavdekar


Monday, 17 August 2020

Performance Target- An underrated feature of Google Ads which Advertisers can use to improve performance drastically- Guide by Sarang Kinjavdekar


Performance marketing professionals are getting lot of questions everyday related to the health and performance of the campaigns. Some typical questions are (i) How is the campaign performing? (ii) Will we be able to hit the monthly target? (iii) Is the campaign over-pacing or under-pacing? (iv) Are we within the budget limits?

To answer all these question, Performance Marketers and advertisers can make use of Performance Targets. 


Performance Targets definition

Performance targets allow you to monitor and forecast the overall performance of campaigns so that you’ll know if you’re on track to meet your goals. This can be tracked through Google Ads new feature- Campaign Groups and Performance Targets.

Campaign Groups definition

Before we move forward with the Performance Targets set up and usage, lets understand what Campaign Groups are. A campaign group is a set of campaigns that share a key performance indicator. Campaign groups are helpful for tracking the overall performance of multiple campaigns with similar goals. Setting optional performance targets lets you designate specific, numerical goals for your campaign group, keeping you up-to-date on performance progress.

Example of Campaign Groups?

E.g.:- If You want to launch some campaigns for Back to school campaign, you can launch video, search, display campaign etc and then club them under one campaign group, let’s say “Back_to_School”.

How to create Campaign Groups?


How to set up Performance Targets

After creating the campaign groups, follow the steps below


Lets see this in action, Click on +


Click on Choose a different metric to Target, once you select a metric then Click ADD A TARGET


Once done , the below will open


Performance target settings

A performance target has three settings:

  1. A group of metrics you want to track
  2. The date range for tracking metrics
  3. (Optional) Specific values you want to achieve for the metrics during each date range

How will you measure the performance? -Select 1 from the dropdown


What time frame are you measuring performance for?


Below are the performance targets for the ,measurements

Performance target Example

Lets take an example,we are looking for conversion value on a monthly basis and we want to make sure that:

  1. Spend should not exceed 50,000
  2. Total number of conversions (should be minimum 5000)
  3. Average ROAS 500% (greater than or equal to)
Below is how we do the set up


Click apply to set this up, we can track the Target Vs Actual   Spend, Conversions and ROAS and make sure that the campaign is delivering the results and KPIs that we actually have thought of.


Similarly, you can select the other 3 and set up the Performance Target as per your tracking and campaign requirements


Performance Targets Status

We have 4 different status once the set up is done-

  1. On Track- Based on recent performance, you are likely to meet your performance target. The chance of meeting each target is available on your performance target’s summary card. 
  2. Needs attention- Based on recent performance, you are not likely to meet your performance target. The chance of meeting each target is available on your performance target’s summary card. Consider changing your campaigns’ settings and checking your status again in a few days to see if you’re on track. 
  3. Target met- The performance target’s date range has passed, and you've met your target. 
  4. Target not met- A performance target’s statistics are calculated using day-to-day historical membership, meaning that the performance target only calculates statistics from a campaign during the time period that it's inside a campaign group. This means making any changes to a campaign group’s current membership will not affect the status of its past performance targets.

So, now if you boss asks you a  question (in mid of a campaign) related to you Campaign health and performance, dont say you can probably achieve the target, set up this Performance Target and share the exact status

Thanks for reading!

Sarang Kinjavdekar

Tuesday, 11 August 2020

Optimization Score - Easy guide for Advertisers to improve Ad performance -By Sarang Kinjavdekar

Optimization Score - Easy Guide by Sarang Kinjavdekar

One of the key challenges faced by Advertisers/their Paid Media team is optimization. Campaign creation is just the tip of the iceberg, actual challenge starts when the campaign does not perform to the pre-aligned KPIs like ROI, ROAS, CPL etc. Google has introduced (long time back) this feature called Optimization Score. We will briefly talk about the optimization score in this article.


What is it?

Optimization scores gives you an idea of how your account is performing, this is usually from 0% to 100% (the higher the better). Lets say your Optimziation score is 80%, there is a further room of improvement by 20%.


Please note that Optimization score is not used by Quality score or Ad rank and it is completely different thing altogether. 

How can it help Advertisers?

Whether you’re looking to bring in new website visitors, grow online sales, or get the phones ringing, optimization score can help you deliver results for your business. It is made up of 50 recommendations and help you make your advertising more efficient, reach new audiences, and spend smarter.

It looks across key aspects of your campaigns to identify opportunities for improvement. Apply these recommendations to get the best results for your advertising budget.

Where can I see it?

This is introduced as a new metric in your dashboard. Its real time and you can see the performance of your Account and campaigns immediately on real time basis without any lags or latency. If you look below, the current Optimization Score is 76%, you can improve it to 100% by accepting the recommendations.


What does it show?

Google will give you recommendations to improve your Account performance, its up to you to accept your reject the recommendations.  Recommendations are ordered based on performance uplift, with the most impactful suggestions at the top. I


How does Google calculate it?

Optimization score is calculated in real-time, based on the statistics, settings, and the status of your account and campaigns, the relevant impact of available recommendations, and recent recommendations history.


  1. Some of the key facors Google takes into account to calculate Optimization Scores are below
  2. Statistics, settings, and the status of your account and campaigns
  3. Relevant impact of available recommendations
  4. Recent recommendations history
  5. Trends in the ads ecosystem


As per Google


A combination of statistical models, simulations, and machine learning is used to assign points to each recommendation, based on the likelihood that it will enhance your account’s performance. If a recommendation can have more impact, it’s weighted more heavily toward your overall score.


How to check your quality score?

Step by Step

  1. Log in to your Google Ads account.
  2. From the page menu on the left, click Recommendations.
    Note: In the page that appears, you’ll see your account’s score and available recommendations in these sections: “All recommendations”, “Bidding & Budgets”, “Ads & Extensions”, “Keywords & Targeting”, and “Repairs.”
  3. To filter recommendations of a specific category, click the category name.
  4. To apply a recommendation, click View recommendation under it, then click Apply.
    Note: Each recommendation shows a score uplift, which indicates the possible score improvement from following the recommendation.
  5. To apply all recommendations of a specific type, click Apply all in the recommendation card.
    Example:When you apply all of a recommendation type that has a score uplift of 7%, your account’s optimization score will go up by 7% and the recommendation will be marked as completed.
  6. To dismiss a recommendation, hover over the top right corner of a suggestion, then click X to dismiss.
  7. To dismiss all recommendations of a specific type, click the 3-dot icon3 dot menu icon in the recommendation card, then click Dismiss all.

Source- Google support 


Thanks for reading!

Sarang Kinjavdekar

Saturday, 25 July 2020

Comprehensive Guide- Facebook and Partner Measurement Solutions- By Sarang Kinjavdekar

Measurement is one of the key concerns for Advertisers and Brands. Gone are the days when Clicks, CTRs were the main KPIs. Marketing these days is very much performance and data driven and highly focused on ROI and ROAS metrics.

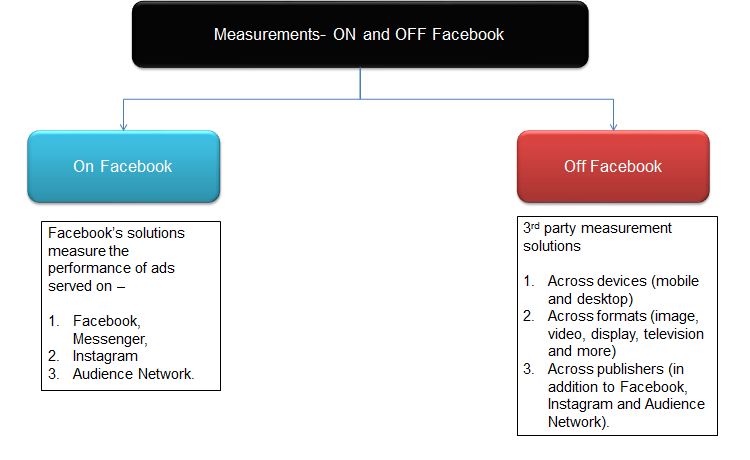
This is a simplified guide for Advertisers, I will talk about how the Facebook and 3rd party/ Partner measure the effect of Facebook Advertisements- both On and Off Facebook across placements and devices .

Facebook measurement solution measures the core business outcomes across 3 major areas, below are more details on this.


It measures the cross device impact as seen below across devices


Advertisers can see if their ads are driving value across their entire media spend, both on and off Facebook properties.


Measuring Audience Outcomes

To measure the audience outcomes, Advertisers should focus on below 4 mentioned key areas as stated below:

  1. Reach and Frequency
  2. Split Testing 
  3. Audience Insights
  4. Viewability

Reach and Frequency


Reach is the number of people who saw your ads at least once, which is different from impressions, which may include multiple views of your ads by the same people. 

Frequency is the average number of times each person saw your ad.


Tip- Combine the Reach and Frequency with Brand Lift and/or Conversion lift. This can help you determine your optimal reach and frequency that’s required to drive your business goals.


Reach is already visible in the dashboard, to activate or make the Frequency visible in the dashboard, just click on the drop-down (select Performance) on top right and once it opens, click on the Frequency text box as shown below


Split Test

The second element after Reach and Frequency under Audience measurement is Split testing.

According to Facebook, split testing can be help you as mentioned below

Split testing helps you understand how different aspects of your ads affect campaign performance across the Facebook family of apps and services. Split testing lets you test different versions of your ads so you can see what works best, then keep building on the success of your campaigns and improve future media plans. Split testing divides your audience into random, non-overlapping groups of people who are shown ad sets that are identical in every way except for the audience, placement or creative strategy variable you've chosen to test.

This randomization helps ensure the test does not introduce other factors that may skew the results of the group comparison. It also ensures each ad set is given an equal chance in the auction.

Split testing is available for 4 variables, you can test one variable at a time

  1. Target audience
  2. Delivery optimization
  3. Placements
  4. Creative.

Audience insights


Audience insights shows the aggregated data and does not show any PII

You can get the below mentioned information by using Audience Insights


  1. Get demographic information including trends about age and gender, relationship status and job roles.
  2. Learn where your audience is located and the languages they speak.

Viewability

Viewability measures how many ad impressions were viewed by your audience and for how long. When combined with reach measurement, viewability can give you a full picture of how your media plan was delivered. You can measure and verify viewability metrics for Facebook and Instagram through select viewability partners.

Facebook works with 3rd party independent vendors to make sure the viewability is properly measured. 


Measuring Brand Outcomes

To measure the Brand outcomes, Advertisers should focus on the below 2 areas

  1. Estimated Ad Recall Lift (people) — known as “EARL” 
  2. Reach. 

Ad recall is measured when people exposed to an ad are later asked if they remember the ad; lift refers to the estimated difference in ad recall between people who saw the ad and those who didn’t.

 The data Facebook shows is not accurate but based on estimates.

To activate this feature in the dashboard, go to Performance and under Engagement, click on 'Estimated Ad recall Lift (people)


Once activated, this is how the data is shown in the dashboard


Brand can check whether or not, the audience can remember seeing their ads

Advertisers and Brands can use Brand Lift to:

  1. Understand how well their campaign resonates with their audience.
  2. See how their campaign performs against the norms for campaigns in their industry and their region.
  3. See the demographic breakdowns (age, gender, TV viewership groups and video view durations) that drive the highest lift.
Below is how the Brand lift works as per Facebook

Polls are served in the platform where the user saw the ad.Before your campaign launches, we’ll randomize your target audience into exposed and control groups with similar characteristics. Between 4 and 48 hours after they see your ad, people in the exposed group will receive a poll pertaining to ad recall or other strategic brand objectives pertinent to your business, such as message association or purchase intent. By comparing aggregated poll results from people who saw your ads (exposed group) with people who didn’t see your ads (control group), you can measure the success of your campaign.


Measuring Sales Outcomes

Sales outcomes help Advertisers and Brands to identify the ads are driving value across your entire media spend, both on and off Facebook

Sales is generally measured as conversions and FB defines it as below

A conversion occurs when a person takes an action that is valuable to your business. Examples of a conversion include people making a purchase on your website, installing your mobile app or viewing a specific page of your website.
There are 2 types of conversions as stated below:

Online Conversions: Measure the actions people take online after people see or engage with your ads. 

How to make this happen? 

To make this actionable, Advertisers needs to implement Facebook pixel on your website and/or Facebook SDK in your mobile app 


Offline Conversions: Measure the number of transactions that occur in your physical retail store(s) and through other offline channels (Ex: by phone) after people see or engage with your ads.

How to make this happen? 

After your campaign starts delivering, you’ll need to upload your transaction data through Business Manager or integrate directly with Facebook using the Offline Conversions API. This allows Facebook to match transactions that occurred offline (via your data) with Facebook’s data on who viewed your ads, giving you a complete picture of the customer journey and the performance of your campaign.


Facebook Conversion Lift

Facebook’s Conversion Lift enables advertisers to measure the true impact of their Facebook ads. 

How Advertisers can use it?

Advertisers and Brands can use Conversion Lift to determine the incremental sales and conversions from people reached by your ads across the Facebook family of apps and services.

This is how it works as per Facebook

When you run a Facebook campaign, Conversion Lift randomizes and splits your ad audience into two groups (one that sees your Facebook ads and another that doesn’t). As your campaign progresses, you can share your conversion data with Facebook, whether it happens online, offline or in your mobile app. We’ll calculate the lift (the additional business you captured) by comparing conversions in the group that saw your ads and the one that didn’t, and make the results available to you in Ads Manager.

Facebook Attribution

With Facebook Attribution, Brands can understand the impact of their ads across publishers, channels and devices.

Facebook offers 2 options for measuring conversions


  1. Visits- Facebook provides a reports on visits across publishers, you have to make sure that you are using UTM parameters with your ads to see this data.
  2. Tags- To  see more advanced data and cross publisher reporting, brands can add other third-party platforms to Facebook Attribution by applying click and impression tags to their off-Facebook media.

Multi-touch attribution


Brands can track multi touch Attribution by working with Facebook partners, this will help brands to:

  1. Track complete Facebook media plan.
  2. Understand  ROI.
  3. Make accurate investment decisions across all media channels.
MTA distributes credit among multiple impressions and clicks that occur over a person's purchase journey, and gives marketers a better look at the full picture.

Marketing mix modeling 


MMM provides insights into sales impacts which leads to determining an optimal budget allocation across channels, brands and countries. 


MMM helps answer the questions: 

  1. How many sales did each of my marketing investments drive?
  2. What was the ROI of each marketing channel across all my brands?
  3. Where should my next marketing investment be?
  4. How would sales be impacted if I made X change to my marketing plan?


Mobile Measurement

Advertisers can work with 3rd party Measurement partners like Adjust to understand how their ads across the Facebook family of apps and services drive installs and revenue for their app compared to other ad networks.


Thanks for reading!

Sarang Kinjavdekar

Wednesday, 15 July 2020

**New Feature***Use Predictive Audiences in Analytics to predict Purchase and Churn Probability

With the advancements of Machine Learning and AI, technology can now help Marketers and Advertisers to predict the behavior and target users based on their future actions.

Google has recently announced a beta feature called predictive audiences, Google Analytics can analyze future data via machine learning and predict the future actions people may take. Currently this is a beta version and is available for App+Web property


What is a Predictive Audience?

As per Google

A predictive audience is an audience with at least one condition based on a predictive metric. For example, you could build an audience for ‘likely 7-day purchasers’ that includes users who are likely to make a purchase in the next 7 days.


What will it detect?

2 things:


(i) Purchase Probability, which predicts the likelihood that users who have visited your app or site will purchase in the next seven days.

(ii) Churn Probability, predicts how likely it is that recently active users will not visit your app or site in the next seven days.


How is it useful?

You can reach and target people who are most likely to purchase and retain people who are about to churn. These audiences are directly shared with Google Ads once created.

Use case

(i) In Re-targeting/Re-marketing  campaigns
(ii) In Re-engagement campaigns

How to create the Predictive audiences?

Below is how you can create the Predictive audiences, it is available for App +Web property

Following options are available:

(i) Likely 7 days Purchasers
(ii) Likely first time 7 day purchasers
(iii) Likely 7 day churning purchasers
(iv)Likely 7 days churning users


Create predictive audiences

Below is a step by step method 

  1. Sign in to Analytics.
  2. Navigate to the relevant App + Web property.
  3. Click Audiences in the left pane.
  4. Click New audience.
  5. Under Suggested audiences, click Predictive.
  6. Suggested predictive audiences that meet prediction-modeling prerequisites are labeled as Ready to use. Click one of the templates that's ready.
  7. Modify the template to your needs using the audience builder. You cannot edit the predictive condition, but you can add additional non-predictive conditions.

What are the Prerequisites?

Below are the details as per Google:

  1. A minimum number of positive and negative examples of purchasers or churned users. In order to be eligible it is required that 1,000 users triggered the relevant predictive condition and that 1,000 users did not.
  2. Model quality must be sustained over a period of time to be eligible.
The metrics for each model will be generated by user, once time per day. If the model quality doesn’t meet the above, the predictions will become unavailable.

Thanks for reading!

Sarang Kinjavdekar